Plotting model
Example of demographic model plot that GADMA draws during run:
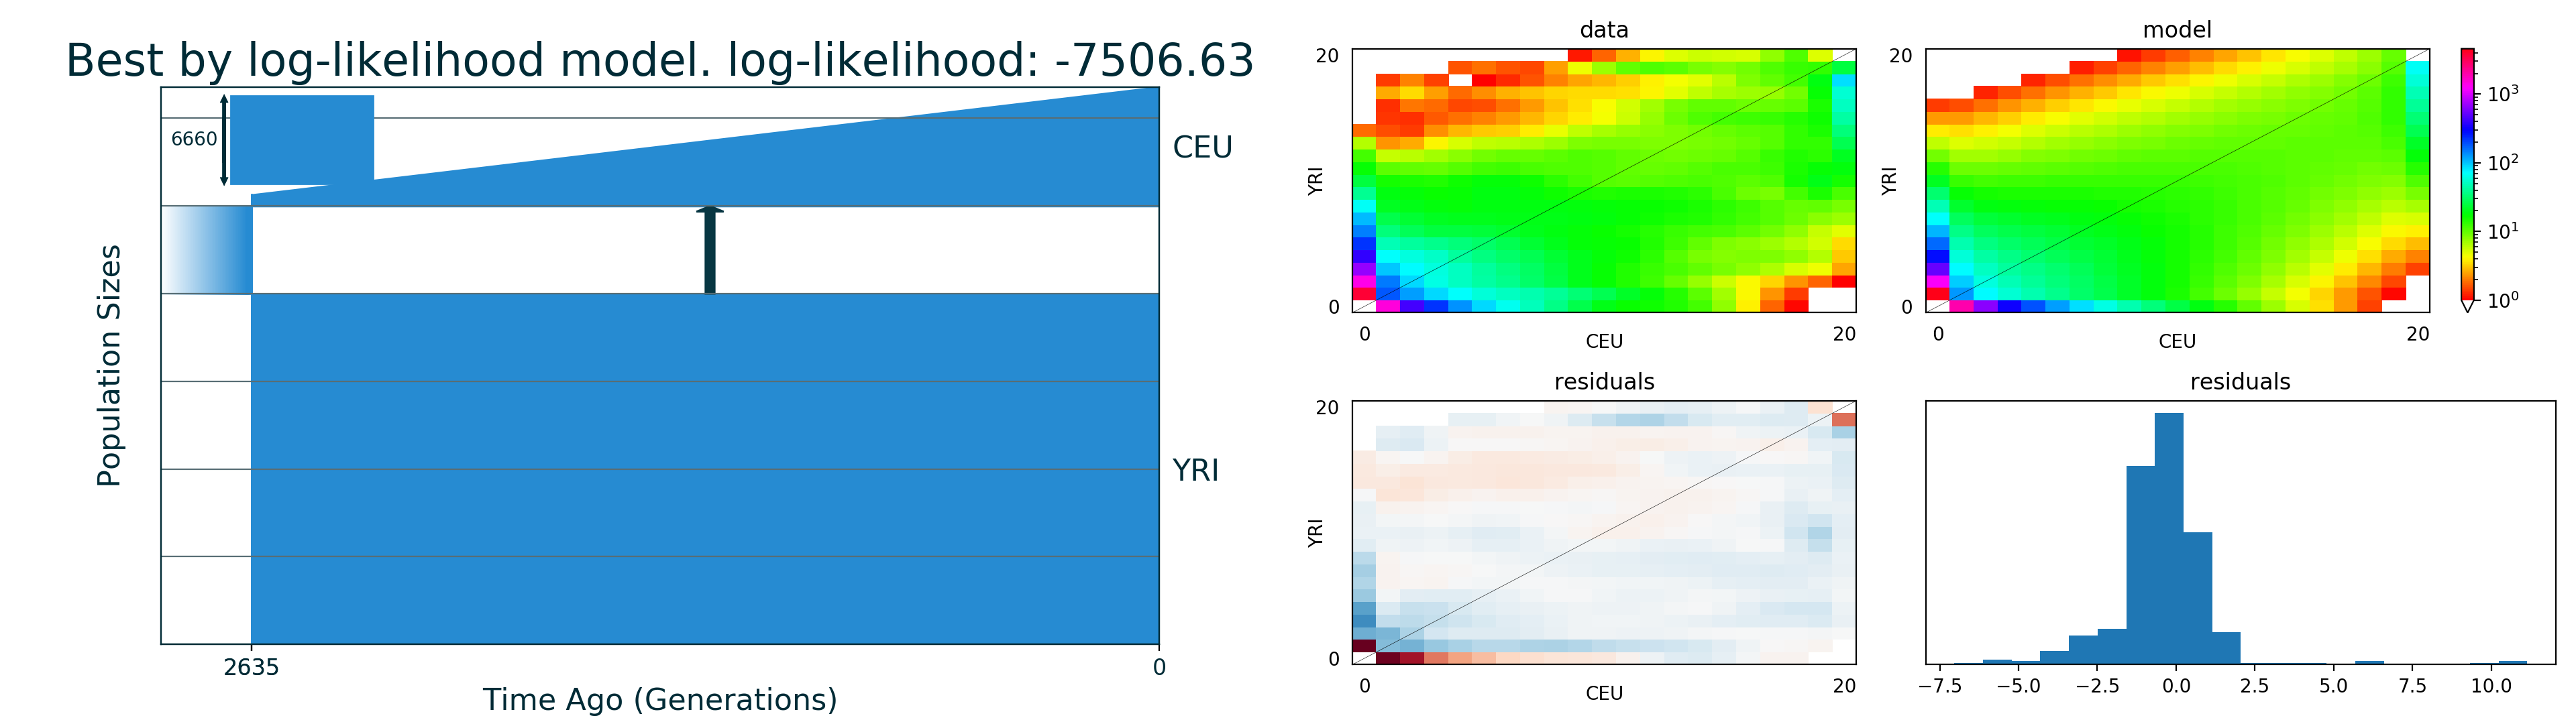
GADMA always draws final best models during genetic algorithms search for best solutions.
However, models can be drawn during the pipeline every N``th iteration of each genetic algorithm. ``N is equal to the value of Draw models every N iteration option in the parameter file. So to enable drawing one should set this option in file.
Warning
Don’t draw models very often: changes are usually not very significant and drawing takes some time, so optimization will be slower.
Note
One can disable drawing by setting Draw models every N iteration : 0 in the parameter file. This is also the default behaviour. Final models will be drawn anyway to the base output directory.
Models are drawn with the moments or demes (+ demesdraw) library, so one of them should be installed if one wants to have pictures. In the top left corner there is a size of ancestry population. Other parameters one can find in string representation of the model in the log files.
Choose engine for plotting
GADMA allows to draw model plots with one of the following packages:
demes+demesdraw(default)momentsmomi
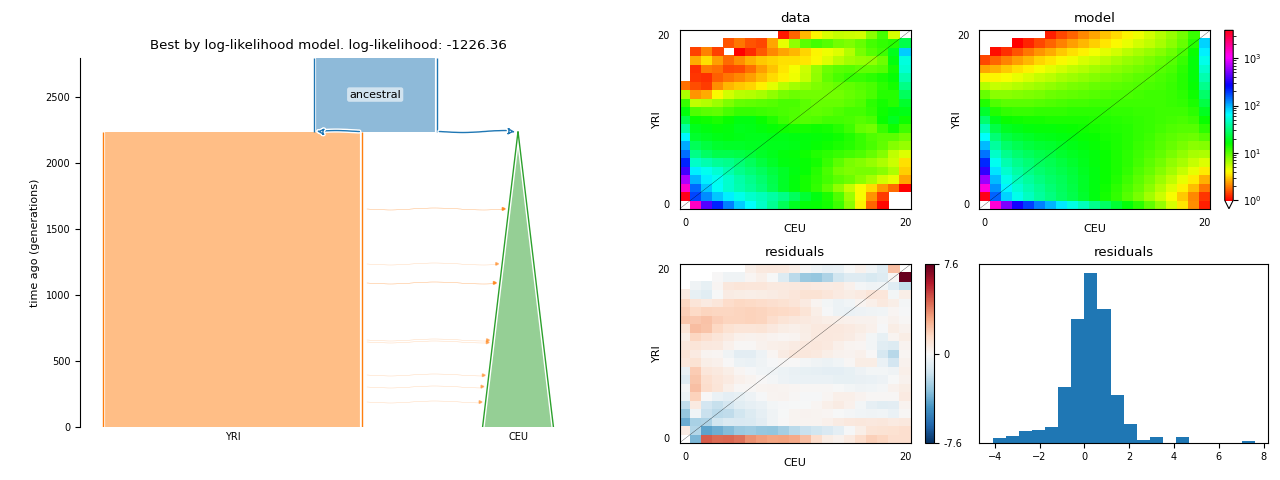
The picture above is example of moments plotting. The demes library plots are vertically oriented and looks a little different. The example of demes drawing is below:
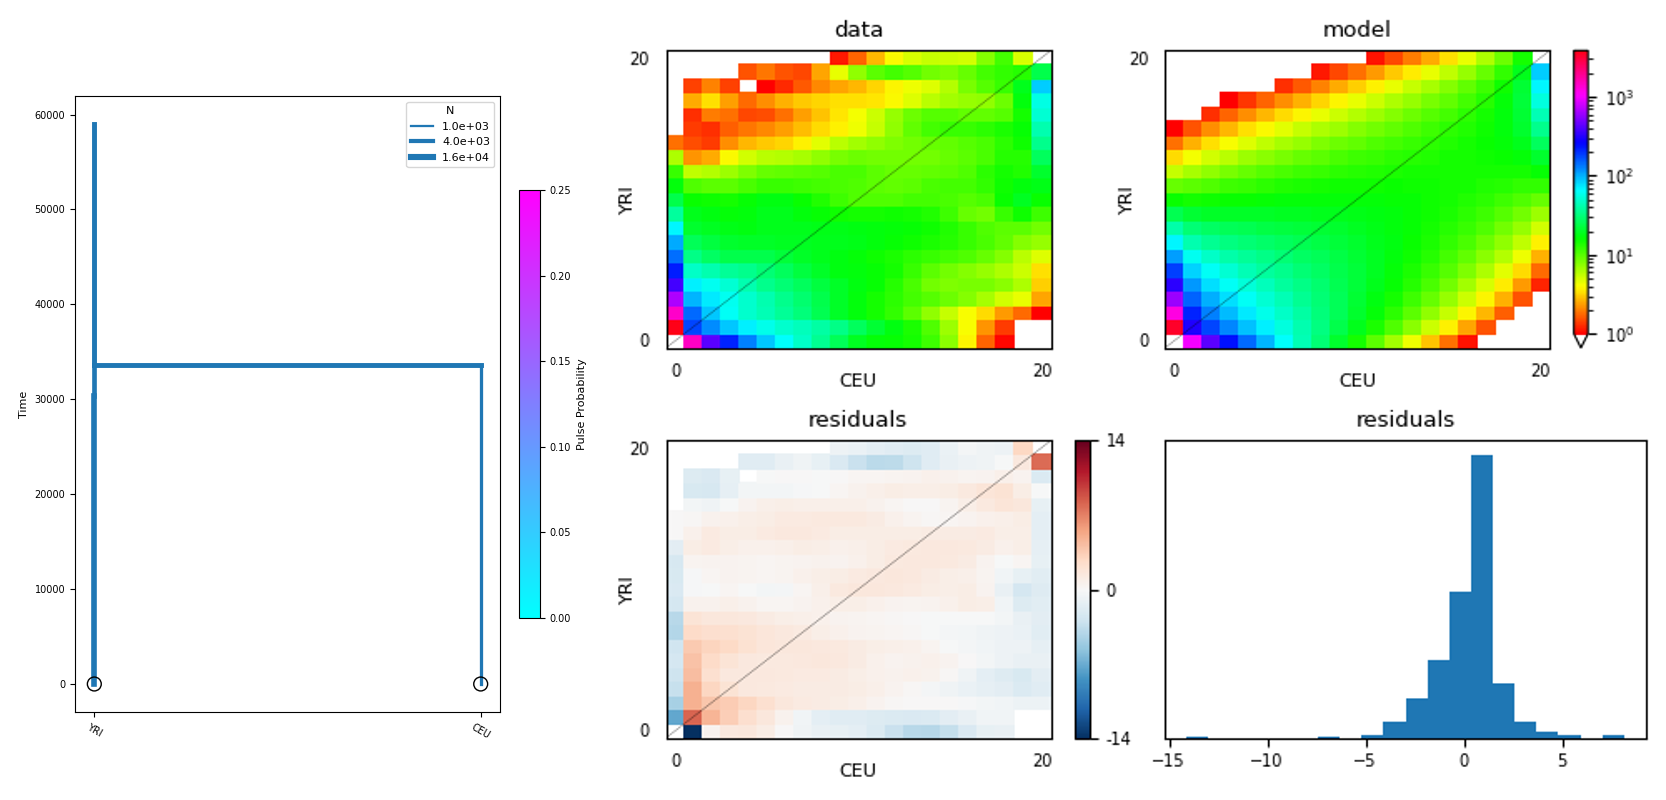
or with momi engine (note that momi does not draw linear size change and migrations):
One could choose the engine for model plotting by setting:
# param_file
...
model_plot_engine: demes
...
Time units on model plot
Time on the demographic model plot can be drawn in units of years, thousand years or in genetic units. By default, the choice depends on the Time for generation option in the parameter file: if it is set to some value (in years) then time will be shown in years, otherwise it will be in genetic units.
Note
If Time for generation is specified, it should be consistent with another option: Theta0, which is described the corresponding section.
But, of course, it is possible to tell GADMA which units are preferable. For example, if one wants time to be in thousands of years on the pictures, as it is a big value in years:
# param_file
...
Time for generation: 25  # years
...
Units of time in drawing : thousand years
...
Plotting after GADMA finished
Example of model’s plot that was drawn with generated python script:
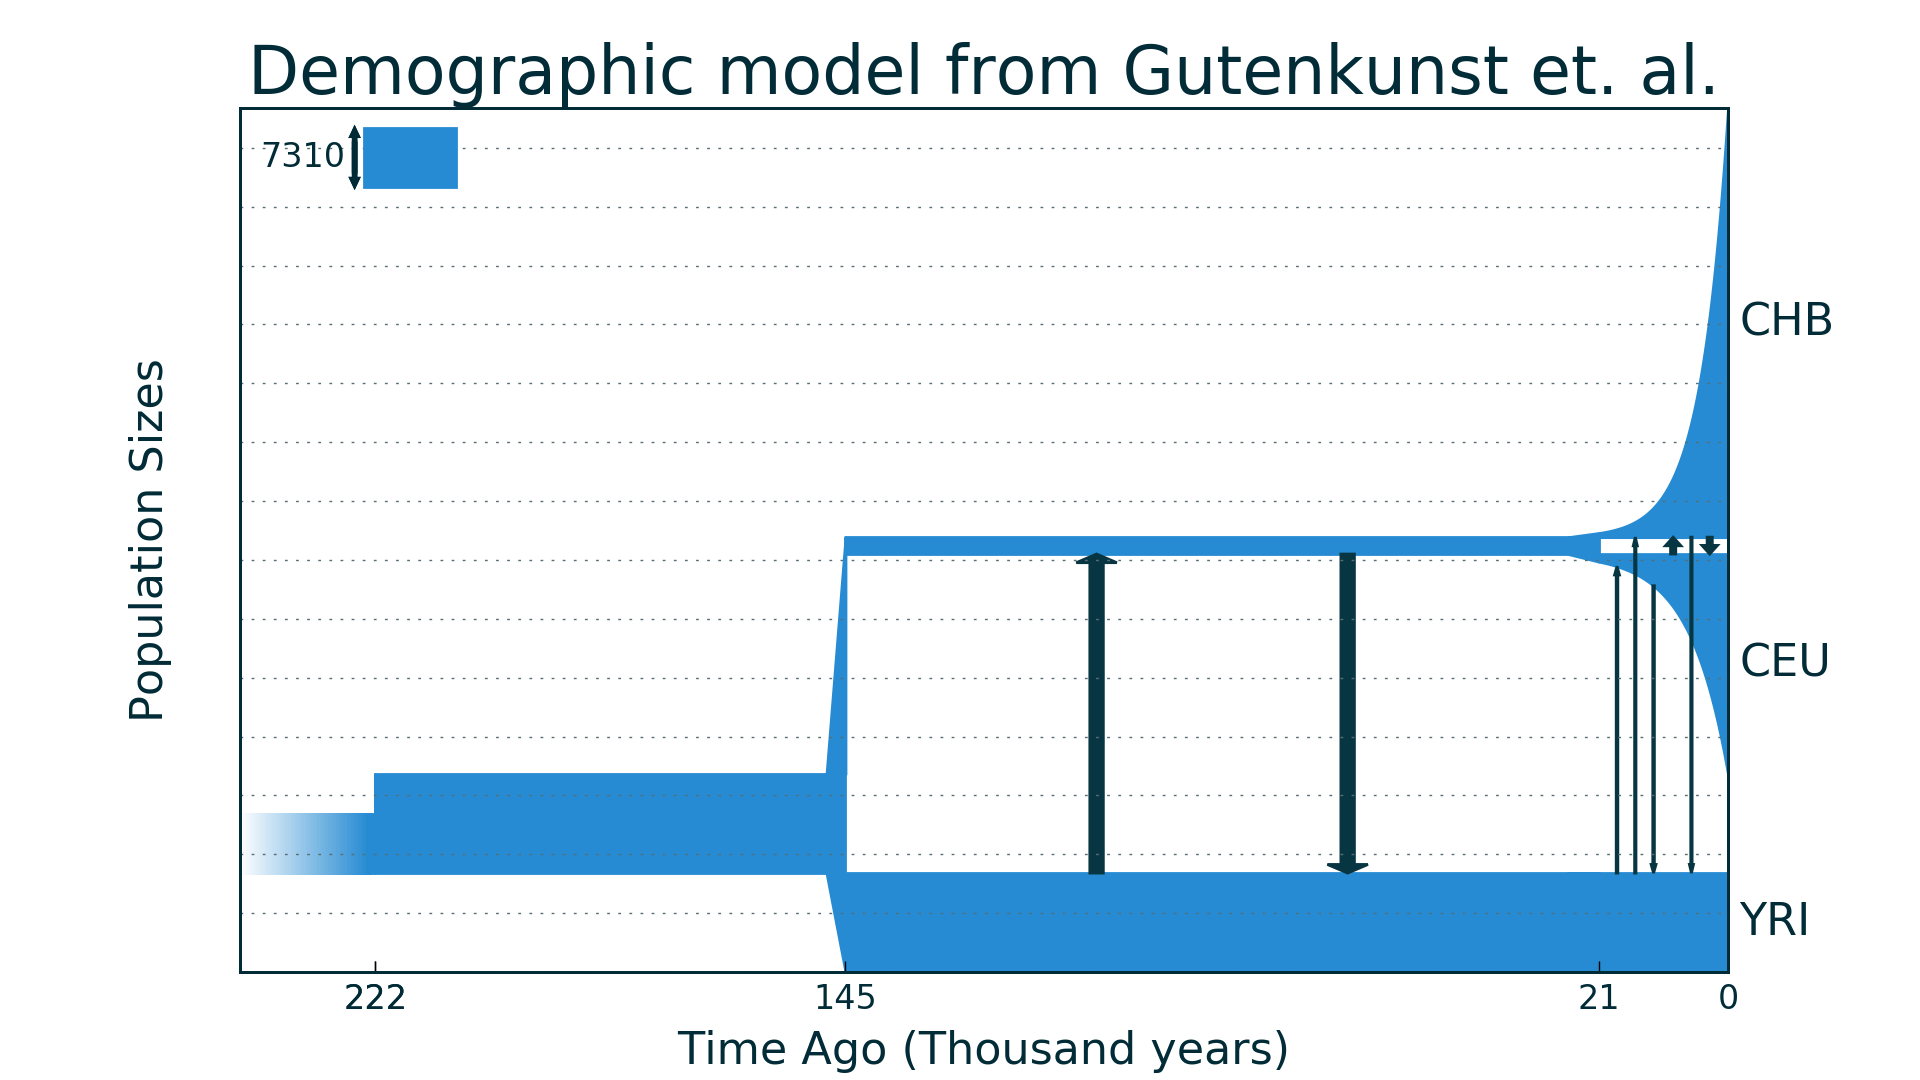
Sometimes final pictures aren’t satisfying or one didn’t draw for some reasons (didn’t want to install moments, wanted a fast launch) it is possible to plot demographic model (and only it) again.
To do it one should run the corresponding generated Python script for the model. For example, the final model can be drawn again in the following way:
$ python best_logll_model_moments_code.py
Note
It is possible only if one has moments installed.
Note
One can change code inside the file and draw again if the picture is not satisfying.